Five Tips for Creating a Successful Infographic

Infographics are a great way to add a visual “bang” to your marketing message—because they turn complex data and statistics into a more compelling, memorable format.
But did you know there’s actual science behind why your brain craves infographics? Studies show that it takes you less than 1/10 of a second to understand a visual scene and that color visuals increase the willingness to read by 80%. To really prove the point, NeoMam Studios put these types of statistics into an interactive infographic about infographics. And the stats are easier to digest, fun to share and extremely engaging.
Of course, there’s one big hurdle to jump—the mere act of creating an infographic doesn’t mean that people will actually want to share it. Great infographics have an engaging story that goes beyond pretty pictures and charts. Here at DeLaune and Associates, we’ve identified five key tips for creating a successful infographic:
Define your goals. Jumping onto the infographic bandwagon doesn’t make sense for everyone. To make the most of the project, consider your goals. Who is your target audience? Will the infographic help position your company as a thought leader, build brand awareness or promote a specific product? What’s the most important thing to communicate in the infographic?
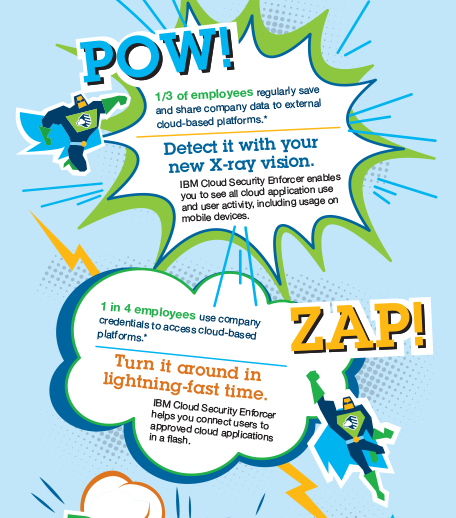
Develop the narrative. The best infographics take readers on a journey from point A to point B. In some cases, a single metaphor can bring the content to life. For example, our recent infographic for IBM Security uses a compelling superhero metaphor to integrate key facts and product messages. (It helps that the product itself sounds like a superhero: IBM Cloud Security Enforcer.)
Identify your data. Infographics need to have an impactful layout and design, but what about the “info” they’re trying to convey? Original research and peer-reviewed sources are ideal for supporting your key messages. The combination of great data and compelling imagery is what drives infographics to be shared through social media.
Use the right style. To be truly successful, infographics need to support the right facts with the right visual style. Your color choices, typography and graphic elements combine to create the overall tone for the piece. Consider, do you want your message to be perceived as creative, fun, warm or educational? Our award-winning infographic for IBM Microelectronics uses vibrant colors and playful imagery to promote their “BIG” accomplishment of shipping 10 billion RF SOI chips.
Reinforce your brand. Although the primary goal with an infographic is to reach your target audience, you should never miss an opportunity to reinforce your brand identity. For example, our IBM infographics are able to convey messages with clear personality, while still using the IBM brand colors, typeface and logo.
If you’re ready to add infographics into your content strategy, we’re here to help. Give us a call to get started, and our team will work with you to create an infographic that supports your vision—and drives engagement.


Leave a Reply